
Pitch
Climate.IQ is a web tool that uses spatial and statistical analysis to conduct climate risk assessmennt for properties and communities.
Description
Summary
Due to climate change, average temperatures and sea levels are rising, and precipitation patterns might change. Many of these changes are already occurring, and are projected to become more severe in the future. Therefore, the risk and vulnerability identification process has been increasingly considered as an important step during policy making, risk management and everyday decision making.
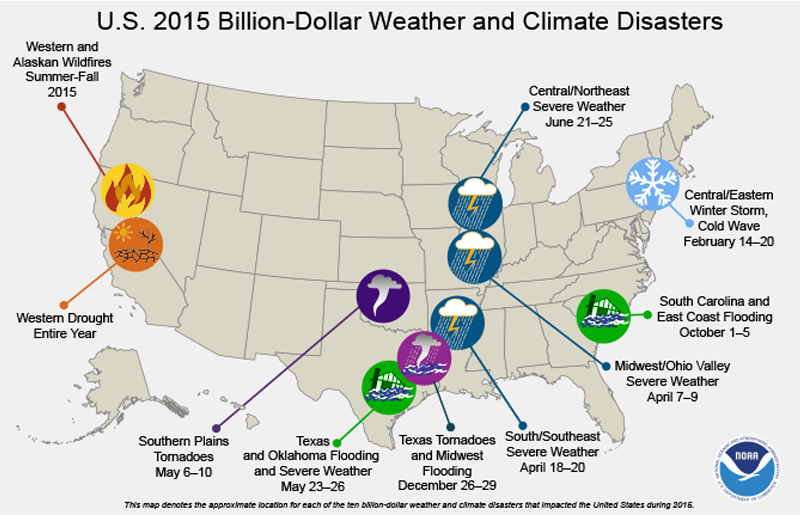
Figure 1. Billion dollar disasters in 2016. Credits to NOAA.
CINCS team proposes Climate.IQ, a web-based tool that will consider relevant hazards associated with a changing climate, vulnerability of an asset or a community and suggest potential adaptation opportunities. The approach CINCS takes to achieve the goal is the classic social vulnerability to climate change framework. This consists of hazard exposure analysis, sensitivity analysis, and adaptive capacity analysis. More specifically, the framework will combine qualitative, quantitative, and geospatial analysis with data collected from indicators and interviews. The data to be collected and the analysis methods for the 3 dimensions (Exposure, Sensitivity, and Adaptation Capacity) of climate risk assessment are further defined by the 2 dimensions of the analysis scope: objective (i.e. property, community, etc.) and activity (i.e. real estate, conservation, agriculture, etc.) (Figure 2).
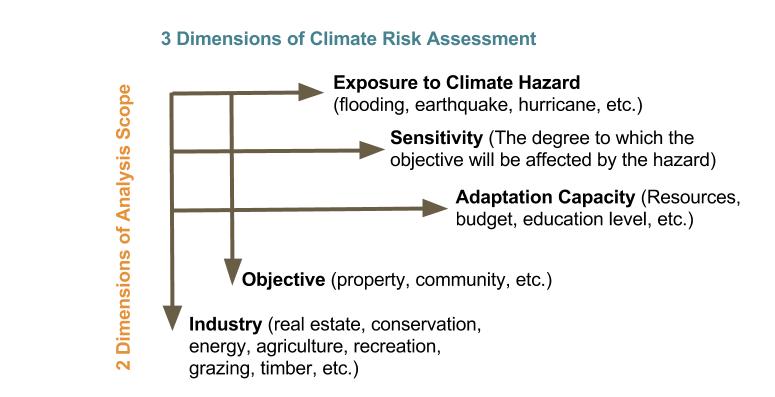
Figure 2.
Climate.IQ is aimed to develop climate risk assessment and adaptation strategies first at the propoerty level, which can be used by real estate, retailers and manufacturing, and then at the community level, which can be applied to agriculture, urban, conservation, and land planining. The detailed features and potential users for both modules are laid out below. Based on the vulnerability assessment, adaptation strategies will be suggested. Climate.IQ will serve as an interactive platform for users to access all information and results from the analysis. The framework of Climate.IQ is presented below (Figure 3).

Category of the action
Mitigation/Adaptation, Changing public attitudes about climate change
What actions do you propose?
-
Climate-Associated Hazard Exposure Analysis (Quantitative)
The first step of the analysis is to conduct a hazard exposure assessment at a refined resolution (3 m - 250 m depending on the resolution of the remote sensing data). This is a spatial and statistical assessment. Exposure is defined as the likelihood of risks and stressors associated with or exacerbated by climate change or other hazards that could have repercussions for a community. The risks and stressors we are specifically looking at include flooding (riverine flooding, coastal flooding and spring flooding), heatwave, drought, snow, wildfire, hurricane and tornado.
For each stressor, the analysis follows similar steps:
-
Hazard indicator design (i.e. precipitation, wind, sea level rise, water depth, etc.)
-
Collect data or model data (i.e. hydrologic and hydraulic models to model water depth data).
-
Data interpolation at each grid point.
-
Calculate extremes for different recurrence intervals based on historical data, coupled with downscaled climate change projection from CMIP(i.e. projected temperature, etc.) to design hazard-probability curve.
-
Conduct simulations to generate an ensemble of scenarios.
-
Design exposure score.
The analysis results will be aggregated or resampled to be on the desired geo unit level, including asset level, state level, county level and other management levels.
Here we briefly demonstrate the hazard exposure analysis under the impacts of climate change on riverine flooding, coastal flooding and hurricane.
Riverine Flooding
To generate the water depth-probability curve, the team models the water depth at each modeling grid for historical flooding events. By inputting historical hourly precipitation data into the precipitation-runoff model, we will generate inundation area and water depth. The modeled flooding data can be validated by MODIS flood data. Time-series of historical events will be generated for 250m grids on map to validate our own model.
Then, we consider the downscaled future precipitation data generated from climate models, which is available at CMIP5 site. This data will be resampled and fed into our validated model to project future flooding events and water depth. We will fit plausible probability distribution curve to the data and run simulations. Eventually, the probability and water depth of flooding in each model grid cell for future years can be estimated to account for the impact of climate change.
An alternative of the complicated method is simple weighted additive index, which combines factors such as precipitation, topography, vegetation cover, soil moisture and other factors to reflect the flooding risk. This method has been validated by past events to have an estimated 30% correlation with historical flooding loss.
Coastal Flooding
To consider the coastal flooding risk exacerbated by future sea level rise, we take the range of sea level rise magnitudes for 2050 and 2100 available from the stations along the coast. Then the historical water level data will be obtained from stations and estimated for a particular recurrence interval. All the station data will be layered with grid units and interpolated along the coastal line. A plausible probability distribution will be inferred for the sea level rise range based on the triangular function. We then use a Monte Carlo procedure to sample from this distribution and add the resulting sea level values to the water levels.
These water level data will then be used as the boundary forcing in the flooding model to model two-dimensional coastal floodplain inundation area and inundation depth. This yields an ensemble of simulations for a given recurrence interval event, where each member represents a different possible scenario of sea level rise by 2100. The flood extent in each simulation will be weighted and combined to estimate the probability of flooding in each model grid cell due to sea level rise.
2. Vulnerability Analysis (Quantitative)
To understand what these climate associated hazards will do to an asset or a community, the tool also conducts vulnerability assessment as another primary focus of the risk assessment. The vulnerability of a house can be influenced by its housing structure, material, and potential financial loss, while for a community, the vulnerability can be evaluated by the distribution and resiliency of populations, key infrastructures and economic activities. The vulnerability of a community increases if it has high reliance on environmental conditions and low preparedness toward climate change.
There are two types of object for vulnerability assessment: assets and communities that are of people’s concerns. Examples of assets include houses and infrastructure. Communities infer to activities that are planned at a community level, such as population, recreation and building stock.
Then there are two types of quantitative vulnerability assessment: general assessment and detailed assessment. The general vulnerability framework is very simple. It helps identify the objects that are at different risk levels. It also measures vulnerability by analyzing the sensitivity of the object. Sensitivity is defined as the characteristics of a system that influences the degree of impact from a stressor, which can be measured by economic reliance on biophysical conditions or processes that could be altered by climate change. The sensitivity of activities to climate change can be very different depending on system of interest.
Detailed consequence assessment method is mostly used to understand the potential financial damage of the object due to the hazard exposure. For example, the vulnerability analysis of a property under flooding risk will require collecting data such as housing characteristics and construction material, as well as the modeled water depth-cost percentage curve.
The vulnerability level will also be quantified as a vulnerability score.
Formal municipality vulnerability standards will be combined with the system when applicable.
Here, the detailed vulnerability analysis method for residential buildings and basic vulnerability assessment for grazing activities are shown as examples.
Object: Residential Buildings at Asset Level
Method: Detailed Vulnerability Assessment
Hazard: Flooding
From the hazard exposure module, we model the hazard curve, i.e. water depth as a function of the return period, for each grid point. The damage data of past flooding events in the community is then analyzed in order to detect correlation between water depth and building parameters. In order to calculate the amount of damage, a damage model is developed. The basic equations for the monetary loss amounts can be expressed as a function of water depth, based on different house parameters.
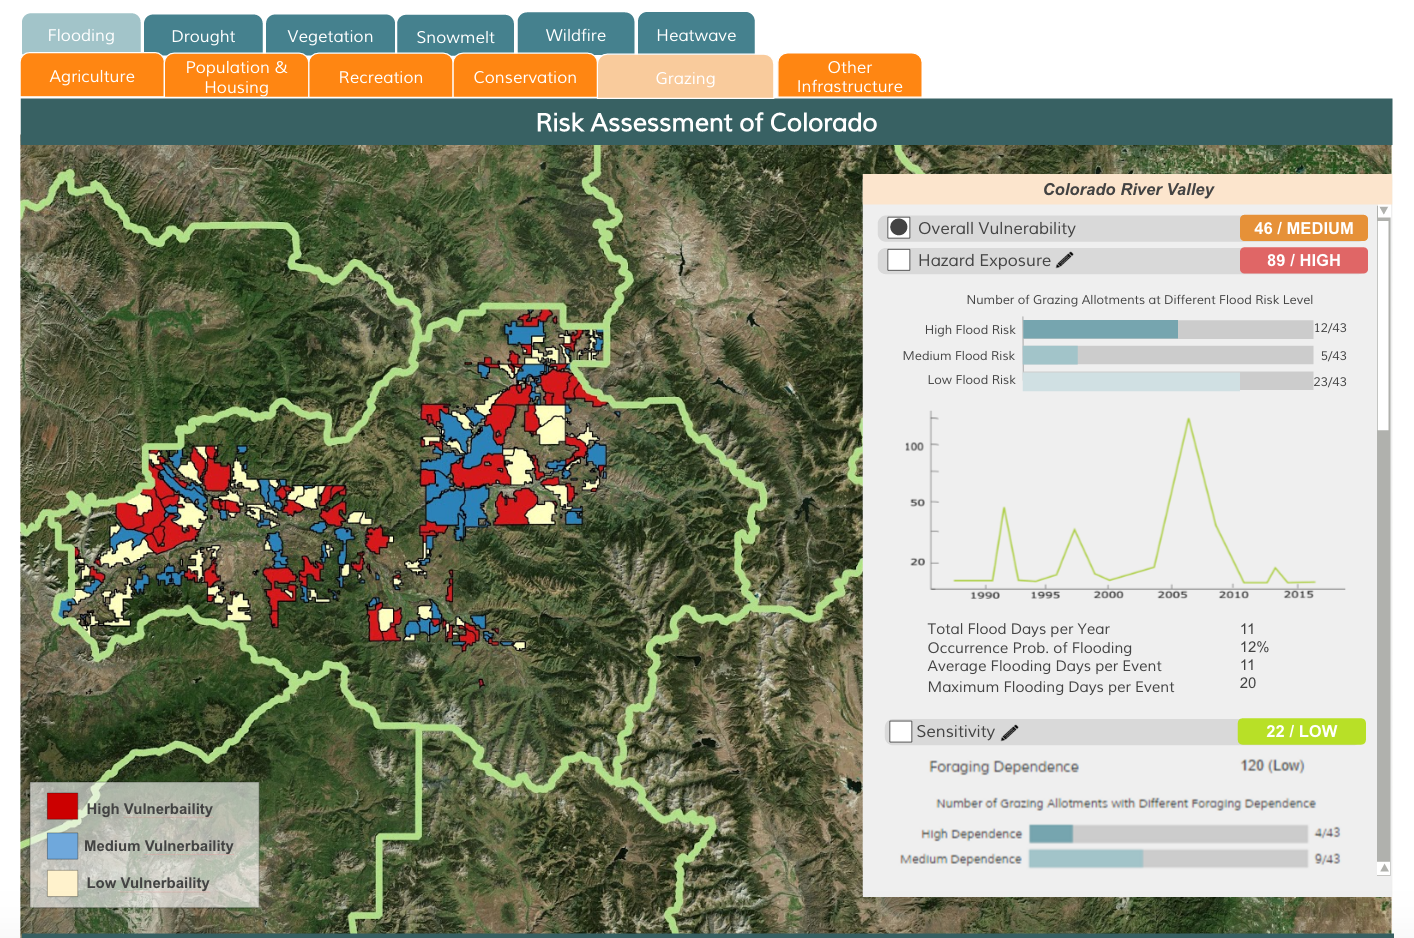
Object: Livestock ranching/grazing at Community Level
Method: Basic Vulnerability Assessment
Hazard: /
The sensitivity of grazing is measured by “forage dependence”, which is determined here by using AUM (Animal Unit Months) and grazing permits per field office and per grazing allotment. Data include the type of animals for grazing, the number of cattle or sheep grazed on public lands, and the number of months the permit/lease allowed to graze livestock on public lands. The more dependent grazing activity is on public lands, the more sensitive it is to climate change. Another indicator used to measure sensitivity is the income from grazing activities and its percentage of total revenues from other services and activities. This data will be collected with the help of local offices. To further understand the impact of climate stressors on grazing, we also proposes to conduct regression analyses to explore the correlations between hazard indicators and grazing sensitivity.
Adaptive capacity is the combination of local social characteristics and external social forces that influence whether and how human communities take action to reduce their exposure or modify their sensitivity to climate change, its related impacts, or other hazards. Adaptive capacity reflects the ability of communities to actively respond by modifying their social norms, behaviors, and policies to anticipate or reduce risks from climate change.
In this stage, Climate.IQ evaluates the adaptation capacity of the management unit by collecting the following data from the audience:
-
Proportion of population living at a poverty threshold;
-
Size of budget toward climate change adaptation;
-
Educational attainment in a community;
-
Rating on overall political position on climate change adaptation;
-
Rating on social and institutional relationships that foster trust, fairness, mutual understanding, learning, and collective action.
3. Interviews as Case Studies
Vulnerability in many cases is analyzed by collecting quantitative data and analyzed in statistical methods, which has been an effective method. However, we also want to highlight the importance of qualitative methods. In comparison to quantitative approaches in vulnerability research, the individual perspectives provide supplemental and deepened information about distinct perceptions and the handling of factors determining vulnerability.
After identifying the locations with high climate risk level (high hazard exposure and high vulnerability level), we will try to conduct interviews in those areas in the form of individual interviews and focus groups. Interview questions will be designed, such as background, observations of climate and weather impacts, personal life and businesses affected by climate hazards, decision-making in the context of climate and weather, flexibility in decision-making, and information needs. Each interview will last approximately 30 minutes.
Then, different groups of long-term local residents with varied background, will be invited for interviews, such as property owners, livestock ranchers, conservation groups, and retailer owners. The contact list and interviews will be done with the help of local organizations and governments. The results will then be collected and analyzed by CINCS team.
The data will be analyzed by NVivo, a software used to conduct qualitative analysis of unstructured data. The case studies will serve for the purpose of complementing the previous analysis with people’s real life experience to validate our analysis.
4. Adaptation Strategies Based on Results from Stage 1, 2 and 3
Adaptation strategies will be suggested based on the results from Stage 1, 2 and 3 for properties and communities. All the properties and communities with high ecological and social vulnerability will be identified. If the hazard exposure score is high, actions can be taken to improve resilience towards the hazard. Flood-proofing structure is one of the examples. If the sensitivity score is high, policies, such as reducing recreation and grazing permits, can be promoted on the especially sensitive public lands. If the adaptation capacity is low, the local officers can work toward the goal of improving its capacity, such as applying more budget to climate change adaptation.
5. Online Portal for Data Mapping, Information Storage, Access and Modification
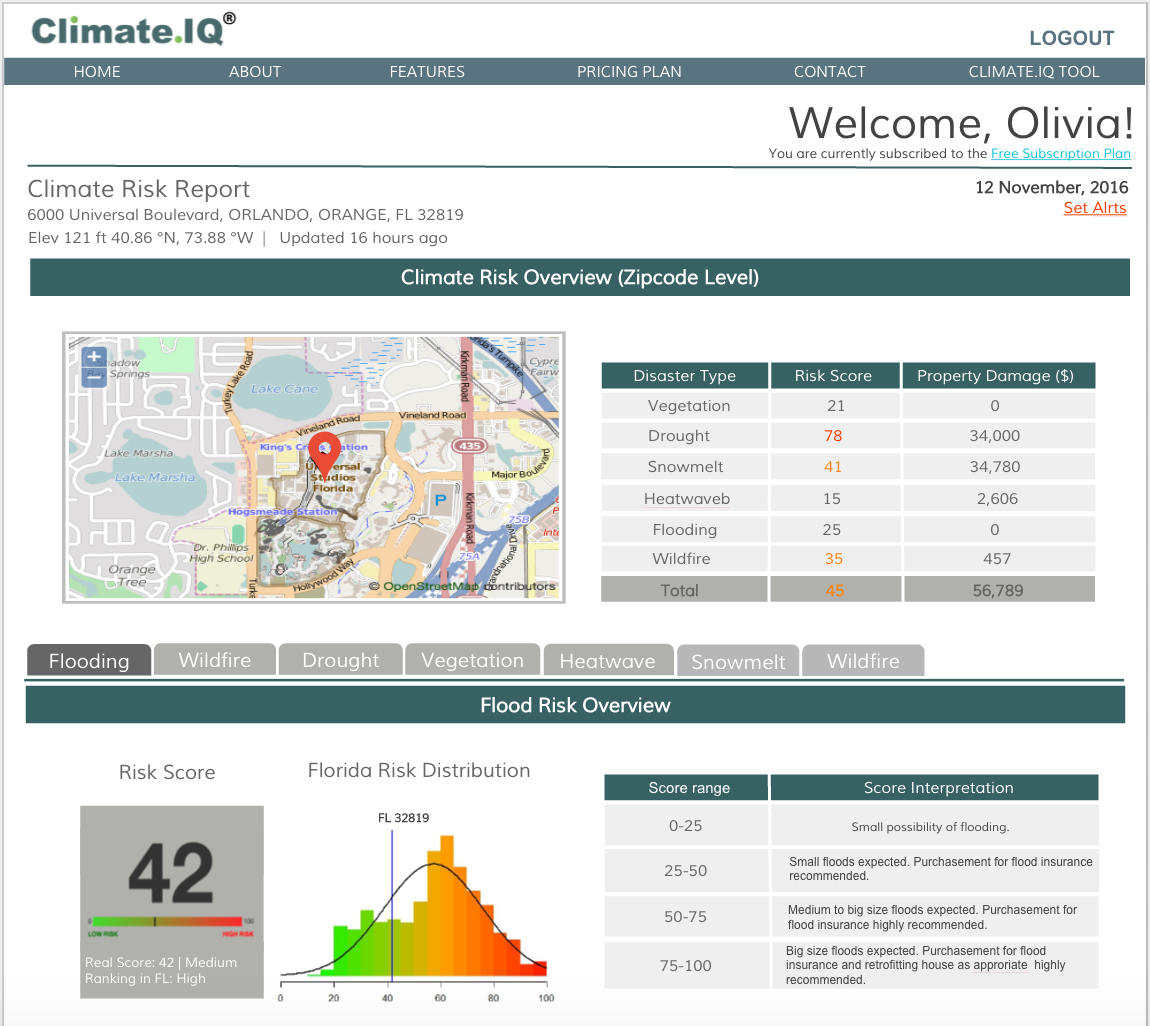
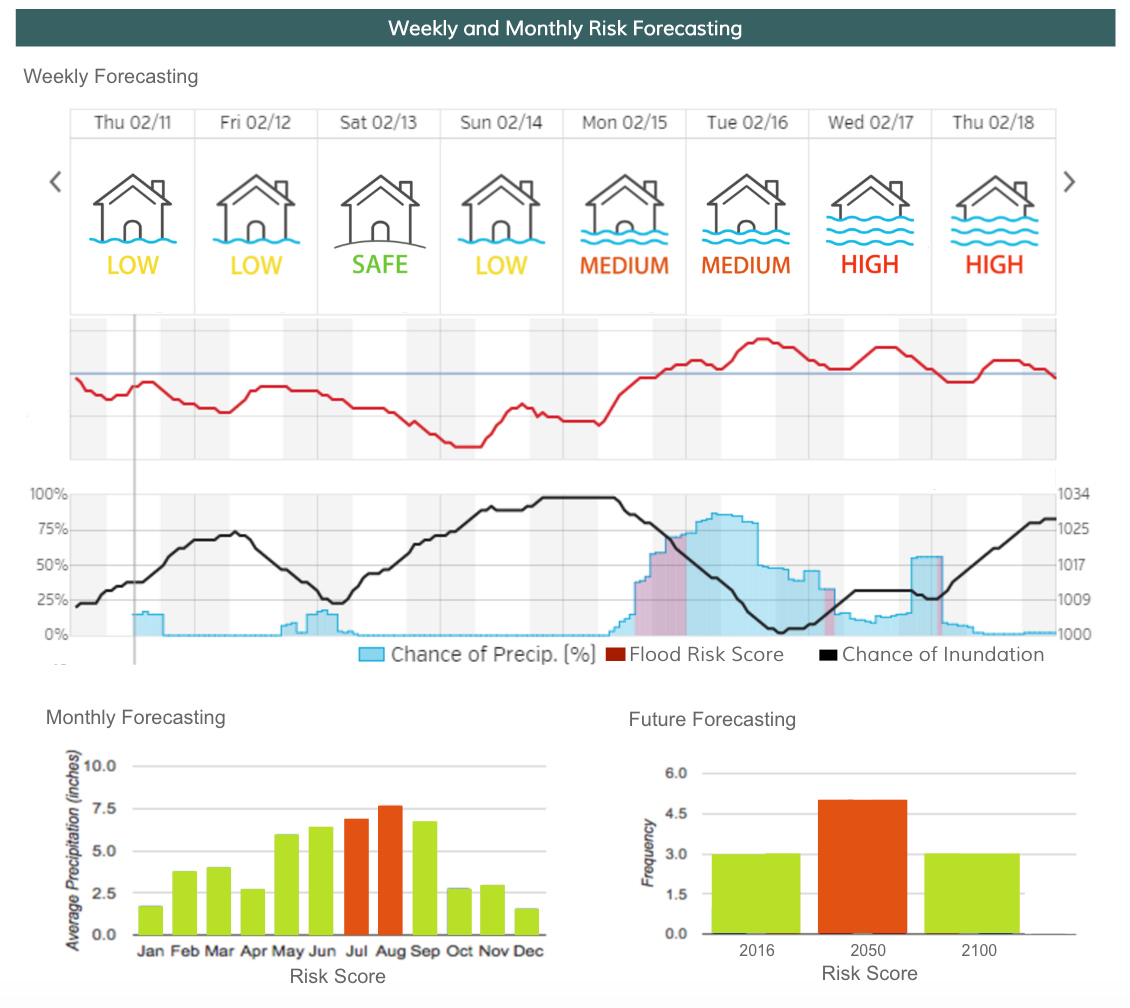
Climate.IQ is a web-based tool to provide climate risk assessment and adaptation strategies for properties and communities. The IT team has already developed a Beta climate risk assessment tool. As most of the outputs of this kind of assessment exist in the format of reports, Climate.IQ is proposed as an interactive online portal to store, access and track all the information and analysis resulting from the vulnerability assessment. A user-friendly and interactive information exchange platform can help people from different backgrounds (i.e. planning, science, education, etc.) to make the best use of the analysis and results. The mock-ups of the portal are presented below. We are still at planning stage.
Property Risk Assessment Module (Mock-up (not product) presented):

Community Risk Assessment Module (Mock-up (not product) presented):
Who will take these actions?
The production team - Our Climate.IQ production team is consisted of a group of environmental scientists, GIS specialist, statisticians, software developers, and communication analysts. The specialty of each person is key contribution to the tool.
The interviewee - The people who will help us conduct interviews are also important participants in this project. As most of them will be direct or indirect victims of climate hazards, their personal experience will be analyzed and used to validate our analysis, as well as providing a context for the analysis. These people will be recruited through partnerships with different local organizations and governments.
The decision maker - The people who will directly use this tool and make the changes necessary to make our society more resilient to climate change are the decision makers. Whether they are making decisions in governments, business world, or non-profit organizations, if they use the tool to help make decision regarding climate change adaptation, the impact of Climate.IQ can be maximized.
The decision maker - The people who will directly use this tool and make the changes necessary to make our society more resilient to climate change are the decision makers. Whether they are making decisions in governments, business world, or non-profit organizations, if they use the tool to help make decision regarding climate change adaptation, the impact of Climate.IQ can be maximized.
Where will these actions be taken?
In the United States and across the globe. We are currently developing the tool only for the United States, but once that module is done, the geographic scope will be expanded to the other continents. Although data availability and access to the internet will become major obstacles to expand this tool to other countries, we will work our best with what’s available out there.
We have just built the cooperative relationships with Institut African de Grestion Urbaine in Senegal, an organization that works on rural sustainable development, to develop the tool for Senegal and promote its use in the future.

What are other key benefits?
For property owners who concern about what will happen to their properties due to climate change, the benefits include:
-
Understand the climate risk associated with their properties;
-
Make adaptation decisions, such as retrofitting their properties, purchasing insurance and relocating the property.
The project will also benefit planners who want to adapt their community under management toward climate change. Based on the results, they can make decisions and plans such as:
-
Prioritizing vulnerable landscapes for conservation;
-
Developing land use types based on its vulnerability to climate change;
-
Taking the right adaptation strategies to address climate risks;
-
Developing a 10, 20, 50 and 100 year development plan;
-
Developing a plan for vulnerable wildlife.
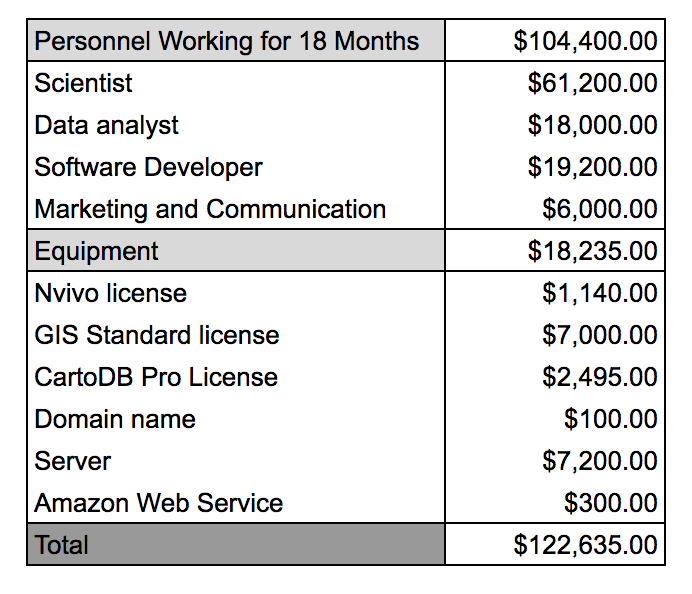
What are the proposal’s costs?
Time line
Short-term timeline:
2015 Sep - Background and market research
2016 Jan - Climate.IQ MVP research
2016 Feb - Climate.IQ MVP development
2016 July - Climate.IQ MVP Beta testing
2016 Sep - Climate.IQ Property Module development
2017 Jan - Climate.IQ Property Module testing
2017 Feb - Climate.IQ Property Module launch
2017 Mar - Climate.IQ Community Module development
2017 July - Climate.IQ Community Module testing
2017 Aug - Climate.IQ Community Module launch
The five-year plan is to increase the forecasting capability of the tool, such as streaming near real time weather data into our model to make alerts on climate hazed.
Our 10-year plan is to expand our modules into other countries across the globe, especially developing countries who lack the resources to help with climate adaptation planning.
Related proposals
References
Dixon, J. M. & Tawn A. J. (1997). Spatial analysis for the UK coast. Retrieved from:
http://www.ntslf.org/sites/ntslf/files/pdf/other_reports/id112.pdf
Fischer, P., Paveglio, T., Carroll, M., Murphy, D., & Brenkert-Smith, H. (2013). Assessing Social Vulnerability to Climate Change in Human Communities near Public Forests and Grasslands: A Framework for Resource Managers and Planners. Journal of Forestry, 1-9. Retrieved from: http://www.fs.fed.us/pnw/pubs/journals/pnw_2013_fischer002.pdf
Gorden, E. & Ojima, D. (2015). Colorado Climate Change Vulnerability Study-A report submitted to the Colorado Energy Office. Retrieved from:
http://wwa.colorado.edu/climate/co2015vulnerability/co_vulnerability_report_2015_final.pdf
Gioia, J. (2015). The Colorado BLM Social Vulnerability Assessment: Climate Change, Management, and Land-Based Livelihoods. [Web log post]. Retrieved from:
http://www.johngioiaphotography.com/social-vulnerability.html
Heneka, P., & Hofherr, T. (2011). Probabilistic winter storm risk assessment for residential buildings in Germany. Natural Hazards. 56(3), 815-831.
Hoagland-Grey, H., Herron, H., Bohn, B., Roy, S., & Evans, W. (2014). IDB Climate Change Data and Risk Assessment Methodologies for Caribbean. Retrieved from:
Hofherr, T., & Kunz, M. (2010). Extreme wind climatology of winter storms in Germany. Climate Research, 41, 105-123. Retrieved from:
http://www.int-res.com/articles/cr_oa/c041p105.pdf
Huang, Z., Rosowsky, V., D., & Sparks, R., P. (2000). Long-term hurricane risk assessment and expected damage to residential buildings. Reliability Engineering and System Safety, 74(2001), 239-249. Retrieved from:https://www.cs.rice.edu/~devika/evac/papers/Hurricane%20risk%20assessment.pdf
Massmann, F., & Wehrhahn, R. (2014). Qualitative social vulnerability assessments to natural hazards:examples from coastal Thailand. Journal of Integrated Coastal Zone Management. 14(1), 3-13. Retrieved from:
http://www.redalyc.org/articulo.oa?id=388340106001
Purvisa, J. M., Batesa, D. P., & Hayesb, M. C. (2008). A probabilistic methodology to estimate future coastal flood risk due to sea level rise. Coastal Engineering. 55(12), 1062–1073.
Website revisited. (2016). Retrieved from BLM Colorado Office website, http://www.blm.gov/co/st/en.html
Website revisited. (2016). Retrieved from NASA MODIS, http://modis.gsfc.nasa.gov/